Qudian Inc. Reports Third Quarter 2021 Unaudited Financial Results
12/13/2021
Third Quarter 2021 Operational Highlights:
- Number of outstanding borrowers[1] from loan book business as of
September 30, 2021 decreased by 3.1% to 2.8 million from 2.9 million as ofJune 30, 2021 , as a result of the Company's deployment of a conservative and prudent strategy - Total outstanding loan balance from loan book business[2] decreased by 14.4% to RMB3.0 billion as of
September 30, 2021 , compared to the outstanding balance as ofJune 30, 2021 - Amount of transactions from loan book business for this quarter decreased by 12.1% to
RMB3.4 billion from the second quarter of 2021 - Weighted average loan tenure for our loan book business was 4.3 months for this quarter, compared with 4.4 months in the second quarter of 2021
|
[1] Outstanding borrowers are borrowers who have outstanding loans from the Company's loan book business as of a particular date. [2] Includes (i) off and on balance sheet loans directly or indirectly funded by our institutional funding partners or our own capital, net of cumulative write-offs and (ii) does not include auto loans from Dabai Auto business. |
Third Quarter 2021 Financial Highlights:
- Total revenues were
RMB347 .4 million (US$53.9 million ), compared toRMB849.4 million from the same period of last year - Net loss attributable to
Qudian's shareholders wasRMB94.2 million (US$14.6 million ), compared to an income ofRMB592.3 million from the same period of last year, or net loss ofRMB0.37 (US$0.06 ) per diluted ADS - Non-GAAP net loss attributable to
Qudian's shareholders[3] wasRMB99 .1 million (US$15.4 million ), compared to an income ofRMB576.4 million from the same period of last year, or non-GAAP net loss ofRMB0.39 (US$0.06 ) per diluted ADS
|
[3] For more information on this Non-GAAP financial measure, please see the table captioned "Unaudited Reconciliation of GAAP and Non-GAAP Results" set forth at the end of this press release. |
"Amid fast-evolving market conditions in the third quarter, we continued to execute a prudent operational strategy in our cash credit business, generating total transaction volume of approximately
"Owing to our stringent credit risk control measures and strategic shift toward better quality borrowers, our asset quality remained stable with the D1 delinquency rate[4] continuing to stay below 5% at the end of the third quarter. We also maintained a solid balance sheet with sufficient liquidity. Going forward, we are confident that our strong fundamentals will help us pursue and sustain long-term growth," said Ms.
|
[4] "D1 delinquency rate" is defined as (i) the total amount of principal and financing service fees that became overdue as of a specified date, divided by (ii) the total amount of principal and financing services fees that was due for repayment as of such date, in each case with respect to our loan book business. |
Third Quarter Financial Results
Total revenues were
Financing income totaled
Loan facilitation income and other related income decreased by 95.0% to
Transaction services fee and other related income increased to
Sales income and others decreased to
Sales commission fee decreased by 55.5% to
Total operating costs and expenses increased to
Cost of revenues decreased by 47.4% to
Sales and marketing expenses decreased by 49.3% to
General and administrative expenses increased by 170.4% to
Research and development expenses decreased by 21.6% to
Provision for receivables and other assets was a reversal of
As of September 30, 2021, the total balance of outstanding principal and financing service fee receivables for on-balance sheet transactions for which any installment payment was more than 30 calendar days past due was RMB132.7 million (
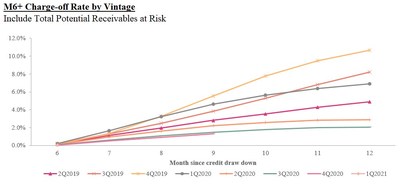
The following charts display the "vintage charge-off rate." Total potential receivables at risk vintage charge-off rate refers to, with respect to on- and off-balance sheet transactions facilitated under the loan book business during a specified time period, the total potential outstanding principal balance of the transactions that are delinquent for more than 180 days up to twelve months after origination, divided by the total initial principal of the transactions facilitated in such vintage. Delinquencies may increase or decrease after such 12-month period.
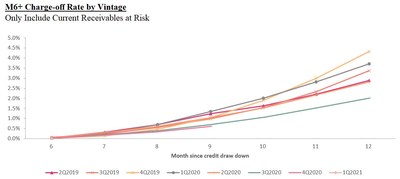
Current receivables at risk vintage charge-off rate refers to, with respect to on- and off-balance sheet transactions facilitated under the loan book business during a specified time period, the actual outstanding principal balance of the transactions that are delinquent for more than 180 days up to twelve months after origination, divided by the total initial principal of the transactions facilitated in such vintage. Delinquencies may increase or decrease after such 12-month period.
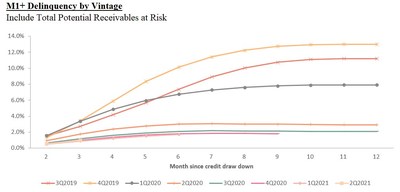
Total potential receivables at risk M1+ delinquency rate by vintage refers to, with respect to on- and off-balance sheet transactions facilitated under the loan book business during a specified time period, the total potential outstanding principal balance of the transactions that are delinquent for more than 30 days up to twelve months after origination, divided by the total initial principal of the transactions facilitated in such vintage. Delinquencies may increase or decrease after such 12-month period.
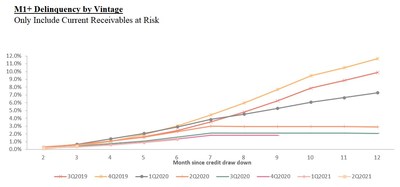
Current receivables at risk M1+ delinquency rate by vintage refers to, with respect to on- and off-balance sheet transactions facilitated under the loan book business during a specified time period, the actual outstanding principal balance of the transactions that are delinquent for more than 30 days up to twelve months after origination, divided by the total initial principal of the transactions facilitated in such vintage. Delinquencies may increase or decrease after such 12-month period.
Income from operations decreased to
Net loss attributable to Qudian's shareholders was RMB94.2 million (
Non-GAAP net loss attributable to
Cash Flow
As of
For the third quarter of 2021, net cash provided by operating activities was RMB87.2 million (
Update on Share Repurchase and Convertible Bond Repurchase
As of the date of this release, the Company has repurchased and cancelled total principal amount of convertible senior notes of
Conference Call
The Company's management will host an earnings conference call on
|
Title of Event: |
|
|
Conference ID: |
7996943 |
|
Registration link: |
For participants who wish to join the call, please complete the online registration 15 minutes prior to the scheduled call start time. Upon registration, participants will receive the conference call access information, including participant dial-in numbers, a Direct Event Passcode, a unique Registrant ID, and an e-mail with detailed instructions to join the conference call.
Additionally, a live and archived webcast of the conference call will be available on the Company's investor relations website at http://ir.qudian.com.
A replay of the conference call will be accessible approximately two hours after the conclusion of the live call until
|
|
+1-855-452-5696 (toll-free) / +1-646-254-3697 |
|||||
|
International: |
+61-2-8199-0299 |
|||||
|
|
800-963-117 (toll-free) / +852-3051-2780 |
|||||
|
Mainland, |
400-632-2162 / 800-870-0205 (toll-free) |
|||||
|
Passcode: |
7996943 |
|||||
About
For more information, please visit http://ir.qudian.com.
Use of Non-GAAP Financial Measures
We use adjusted net income/loss, a Non-GAAP financial measure, in evaluating our operating results and for financial and operational decision-making purposes. We believe that adjusted net income/loss helps identify underlying trends in our business by excluding the impact of share-based compensation expenses, which are non-cash charges, and convertible bonds buyback income. We believe that adjusted net income/loss provides useful information about our operating results, enhances the overall understanding of our past performance and future prospects and allows for greater visibility with respect to key metrics used by our management in its financial and operational decision-making.
Adjusted net income/loss is not defined under
We mitigate these limitations by reconciling the Non-GAAP financial measure to the most comparable
For more information on this Non-GAAP financial measure, please see the table captioned "Unaudited Reconciliation of GAAP and Non-GAAP Results" set forth at the end of this press release.
Exchange Rate Information
This announcement contains translations of certain RMB amounts into
Statement Regarding Preliminary Unaudited Financial Information
The unaudited financial information set out in this earnings release is preliminary and subject to potential adjustments. Adjustments to the consolidated financial statements may be identified when audit work has been performed for the Company's year-end audit, which could result in significant differences from this preliminary unaudited financial information.
Safe Harbor Statement
This announcement contains forward-looking statements. These statements are made under the "safe harbor" provisions of the United States Private Securities Litigation Reform Act of 1995. These forward-looking statements can be identified by terminology such as "will," "expects," "anticipates," "future," "intends," "plans," "believes," "estimates" and similar statements. Among other things, the expectation of its collection efficiency and delinquency, contain forward-looking statements.
For investor and media inquiries, please contact:
In
Tel: +86-592-596-8208
E-mail: ir@qudian.com
Tel: +86 (10) 6508-0677
E-mail: qudian@tpg-ir.com
In
Tel: +1-212-481-2050
E-mail: qudian@tpg-ir.com
|
|
|||||||
|
Unaudited Condensed Consolidated Statements of Operations |
|||||||
|
Three months ended |
|||||||
|
(In thousands except for number |
2020 |
2021 |
|||||
|
of shares and per-share data) |
(Unaudited) |
(Unaudited) |
(Unaudited) |
||||
|
RMB |
RMB |
US$ |
|||||
|
Revenues: |
|||||||
|
Financing income |
487,330 |
285,536 |
44,315 |
||||
|
Sales commission fee |
18,073 |
8,037 |
1,247 |
||||
|
Sales income and others |
138,971 |
7,326 |
1,137 |
||||
|
Penalty fee |
21,258 |
16,746 |
2,599 |
||||
|
Loan facilitation income and other related income |
177,161 |
8,776 |
1,362 |
||||
|
Transaction services fee and other related income |
6,629 |
20,944 |
3,250 |
||||
|
Total revenues |
849,422 |
347,365 |
53,910 |
||||
|
Operating cost and expenses: |
|||||||
|
Cost of revenues |
(198,787) |
(104,551) |
(16,226) |
||||
|
Sales and marketing |
(64,792) |
(32,878) |
(5,103) |
||||
|
General and administrative |
(58,308) |
(157,678) |
(24,471) |
||||
|
Research and development |
(51,100) |
(40,071) |
(6,219) |
||||
|
Changes in guarantee liabilities and risk assurance liabilities(1) |
362,413 |
42,773 |
6,638 |
||||
|
Provision for receivables and other assets |
(89,466) |
19,167 |
2,975 |
||||
|
Total operating cost and expenses |
(100,040) |
(273,238) |
(42,406) |
||||
|
Other operating income |
18,375 |
8,693 |
1,349 |
||||
|
Income from operations |
767,757 |
82,820 |
12,853 |
||||
|
Interest and investment income, net |
(38,786) |
(125,501) |
(19,477) |
||||
|
Foreign exchange loss, net |
(2,596) |
(229) |
(36) |
||||
|
Other income |
613 |
15 |
2 |
||||
|
Other expenses |
(3,462) |
(2,176) |
(337) |
||||
|
Net (loss)/income before income taxes |
723,526 |
(45,071) |
(6,995) |
||||
|
Income tax expenses |
(131,264) |
(50,347) |
(7,814) |
||||
|
Net (loss)/income |
592,262 |
(95,418) |
(14,809) |
||||
|
Net (loss)/profit attributable to non-controlling |
- |
(1,248) |
(194) |
||||
|
Net (loss)/income attributable to Qudian |
592,262 |
(94,170) |
(14,615) |
||||
|
(Loss)/Earnings per share for Class A and Class |
|||||||
|
Basic |
2.34 |
(0.37) |
(0.06) |
||||
|
Diluted |
2.22 |
(0.37) |
(0.06) |
||||
|
(Loss)/Earnings per ADS (1 Class A ordinary |
|||||||
|
Basic |
2.34 |
(0.37) |
(0.06) |
||||
|
Diluted |
2.22 |
(0.37) |
(0.06) |
||||
|
Weighted average number of Class A and Class |
|||||||
|
Basic |
253,523,668 |
253,649,009 |
253,649,009 |
||||
|
Diluted |
268,752,268 |
266,458,506 |
266,458,506 |
||||
|
Other comprehensive (loss)/income: |
|||||||
|
Foreign currency translation adjustment |
(13,991) |
(234) |
(36) |
||||
|
Total comprehensive (loss)/income |
578,271 |
(95,652) |
(14,845) |
||||
|
Total comprehensive (loss)/income |
578,271 |
(95,652) |
(14,845) |
||||
|
Note: |
|||||||
|
|
||||||
|
Unaudited Condensed Consolidated Balance Sheets |
||||||
|
As of |
As of |
|||||
|
(In thousands except for number |
2021 |
2021 |
||||
|
of shares and per-share data) |
(Unaudited) |
(Unaudited) |
(Unaudited) |
|||
|
RMB |
RMB |
US$ |
||||
|
ASSETS: |
||||||
|
Current assets: |
||||||
|
Cash and cash equivalents |
3,133,623 |
1,693,311 |
262,798 |
|||
|
Restricted cash |
296,915 |
287,298 |
44,588 |
|||
|
Short-term investments |
5,024,942 |
6,090,132 |
945,174 |
|||
|
Short-term loan principal and financing service fee |
3,150,299 |
2,741,639 |
425,496 |
|||
|
Short-term finance lease receivables |
88,805 |
62,046 |
9,629 |
|||
|
Short-term contract assets |
26,422 |
13,020 |
2,021 |
|||
|
Other current assets |
679,604 |
1,222,449 |
189,720 |
|||
|
Total current assets |
12,400,610 |
12,109,895 |
1,879,426 |
|||
|
Non-current assets: |
||||||
|
Long-term finance lease receivables |
3,818 |
1,807 |
280 |
|||
|
Operating lease right-of-use assets |
526,259 |
653,719 |
101,456 |
|||
|
Investment in equity method investee |
367,148 |
218,944 |
33,980 |
|||
|
Long-term investments |
243,668 |
255,308 |
39,623 |
|||
|
Property and equipment, net |
436,007 |
556,825 |
86,418 |
|||
|
Intangible assets |
8,733 |
9,375 |
1,455 |
|||
|
Long-term contract assets |
6,154 |
2,072 |
322 |
|||
|
Deferred tax assets, net |
68,231 |
56,315 |
8,740 |
|||
|
Other non-current assets |
463,042 |
567,844 |
88,127 |
|||
|
Total non-current assets |
2,123,060 |
2,322,209 |
360,401 |
|||
|
TOTAL ASSETS |
14,523,670 |
14,432,104 |
2,239,827 |
|||
|
|
||||||
|
Unaudited Condensed Consolidated Balance Sheets |
||||||
|
As of |
As of |
|||||
|
(In thousands except for number |
2021 |
2021 |
||||
|
of shares and per-share data) |
(Unaudited) |
(Unaudited) |
(Unaudited) |
|||
|
RMB |
RMB |
US$ |
||||
|
LIABILITIES AND SHAREHOLDERS' EQUITY |
||||||
|
Current liabilities: |
||||||
|
Short-term lease liabilities |
51,388 |
64,738 |
10,047 |
|||
|
Accrued expenses and other current liabilities |
415,047 |
375,851 |
58,332 |
|||
|
Guarantee liabilities and risk assurance liabilities(1) |
3,252 |
1,184 |
184 |
|||
|
Income tax payable |
34,354 |
52,639 |
8,169 |
|||
|
Total current liabilities |
504,041 |
494,412 |
76,732 |
|||
|
Non-current liabilities: |
||||||
|
Deferred tax liabilities, net |
12,182 |
27,647 |
4,291 |
|||
|
Convertible senior notes |
817,685 |
687,108 |
106,637 |
|||
|
Long-term lease liabilities |
369,666 |
488,060 |
75,746 |
|||
|
Long-term borrowings and interest payables |
145,312 |
145,312 |
22,552 |
|||
|
Other non-current liabilities |
- |
3,268 |
507 |
|||
|
Total non-current liabilities |
1,344,845 |
1,351,395 |
209,733 |
|||
|
Total liabilities |
1,848,886 |
1,845,807 |
286,465 |
|||
|
Shareholders' equity: |
||||||
|
Class A Ordinary shares |
132 |
132 |
20 |
|||
|
Class B Ordinary shares |
44 |
44 |
7 |
|||
|
Treasury shares |
(352,533) |
(348,534) |
(54,092) |
|||
|
Additional paid-in capital |
4,010,672 |
4,013,840 |
622,938 |
|||
|
Accumulated other comprehensive loss |
(56,247) |
(56,480) |
(8,766) |
|||
|
Retained earnings |
9,063,688 |
8,969,516 |
1,392,048 |
|||
|
Total Qudian Inc. shareholders' equity |
12,665,756 |
12,578,518 |
1,952,155 |
|||
|
Non-controlling interests |
9,028 |
7,779 |
1,207 |
|||
|
Total equity |
12,674,784 |
12,586,297 |
1,953,362 |
|||
|
TOTAL LIABILITIES AND SHAREHOLDERS' |
14,523,670 |
14,432,104 |
2,239,827 |
|||
|
Note: |
||||||
|
|
|||||||
|
Unaudited Reconciliation of GAAP And Non-GAAP Results |
|||||||
|
Three months ended |
|||||||
|
2020 |
2021 |
||||||
|
(In thousands except for number |
(Unaudited) |
(Unaudited) |
(Unaudited) |
||||
|
of shares and per-share data) |
RMB |
RMB |
US$ |
||||
|
Total net (loss)/income attributable to |
592,262 |
(94,170) |
(14,615) |
||||
|
Add: Share-based compensation expenses |
6,663 |
7,167 |
1,112 |
||||
|
Less: Convertible bonds buyback income |
22,490 |
12,082 |
1,875 |
||||
|
Non-GAAP net (loss)/income attributable to |
576,435 |
(99,085) |
(15,378) |
||||
|
Non-GAAP net (loss)/income per share—basic |
2.27 |
(0.39) |
(0.06) |
||||
|
Non-GAAP net (loss)/income per share—diluted |
2.16 |
(0.39) |
(0.06) |
||||
|
Weighted average shares outstanding—basic |
253,523,668 |
253,649,009 |
253,649,009 |
||||
|
Weighted average shares outstanding—diluted |
268,752,268 |
266,458,506 |
266,458,506 |
||||
![]() View original content to download multimedia:https://www.prnewswire.com/news-releases/qudian-inc-reports-third-quarter-2021-unaudited-financial-results-301442897.html
View original content to download multimedia:https://www.prnewswire.com/news-releases/qudian-inc-reports-third-quarter-2021-unaudited-financial-results-301442897.html
SOURCE